
Hong Kong Economy and Family Decisions
Hong Kong’s GDP Grew 5.1% in the First Half—Why Do Households and Businesses Feel Differently?
GDP measures aggregate output, not the income statement of every household. When exports, services, consumption and employment move at different speeds, stronger macro data and weaker lived experience can coexist.
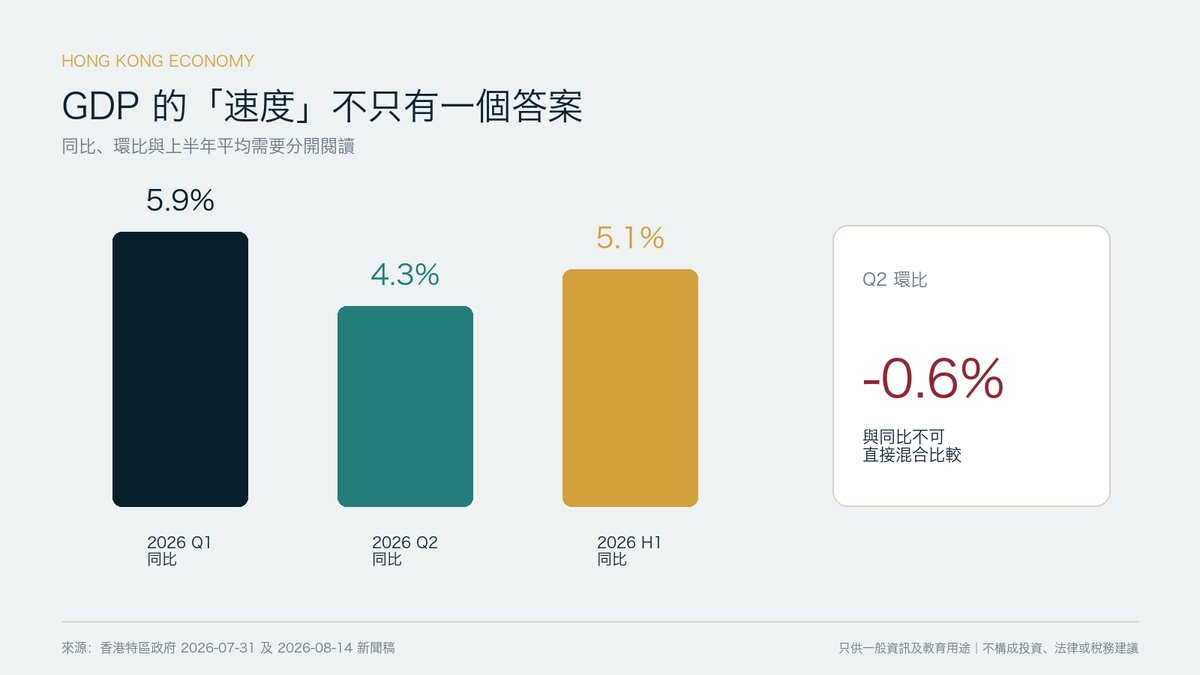
Year-on-year growth and a quarter-on-quarter decline can coexist
Real GDP growth in the first half of 2026
Second-quarter real GDP growth year on year
Seasonally adjusted second-quarter change from the preceding quarter
Start with the official figures
The Hong Kong Government reported that real GDP grew 4.3% year on year in the second quarter of 2026, after 5.9% in the first quarter. Growth for the first half was 5.1%, the strongest half-year performance in nearly five years. The Government also raised its full-year real GDP forecast to 3.5%–4.5%.
Seasonally adjusted GDP nevertheless fell 0.6% quarter on quarter in the second quarter. There is no contradiction: the two figures use different comparison bases. One asks how the economy compares with a year earlier; the other compares it with the preceding quarter.
 Open full-size image ↗
Where the growth came from
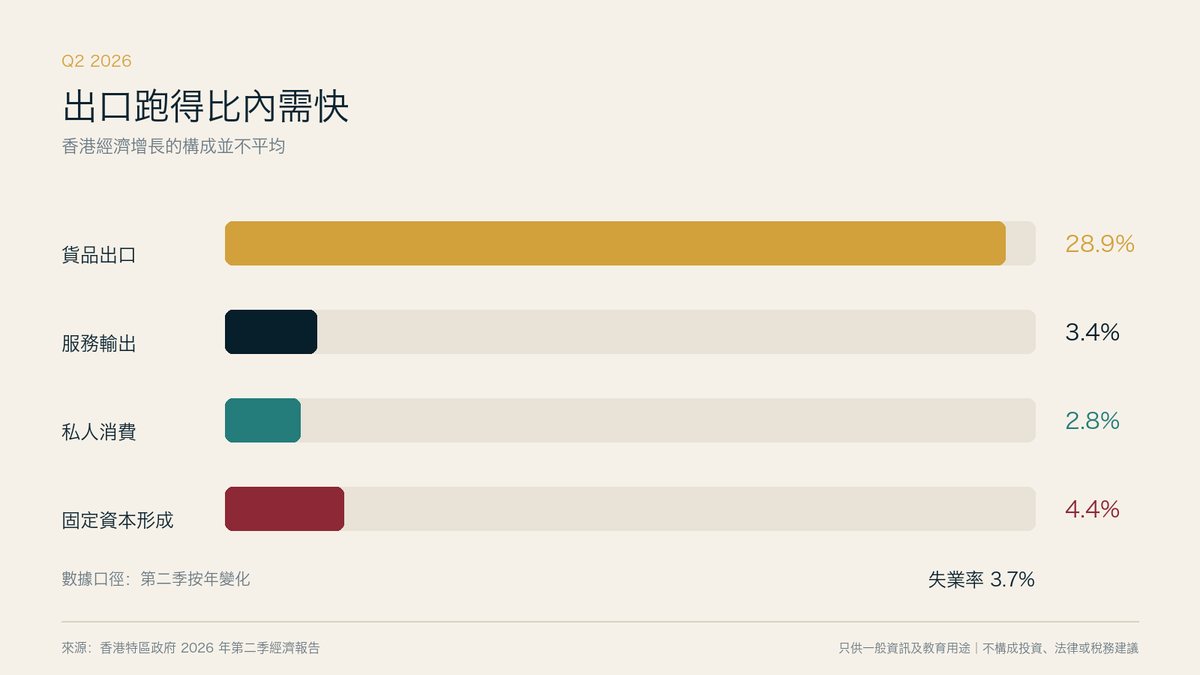
Real exports of goods rose 28.9% year on year in the second quarter, the standout driver. Exports of services increased 3.4%, private consumption expenditure 2.8%, and gross domestic fixed capital formation 4.4%. The seasonally adjusted unemployment rate was 3.7%. That is an economy-wide measure and cannot by itself describe hiring, wages or mobility in every sector.
The figures reveal an important distinction: exports can lift GDP quickly, but the gains are not distributed evenly across industries, employees and small businesses. Households mainly feel wages, rent, mortgages, healthcare and daily expenses, so their experience need not move with export growth.
 Open full-size image ↗
Four channels behind the perception gap
First, base effects can magnify year-on-year growth. Second, industries participate in an export recovery to very different degrees. Third, asset prices and interest rates affect disposable cash flow. Fourth, averages conceal the distribution of income and costs. These are analytical channels, not assumptions about any particular family.
The 5.1% figure is real GDP and therefore removes aggregate price changes. But an individual's rent, education, care or insurance costs may not move in line with the overall price index.
G70 perspective: one growth rate is not a household allocation plan
A better macro environment is welcome, but family decisions should separate income sources, asset prices, financing costs and committed expenditure. For entrepreneurial families, practical questions include whether export strength is becoming orders and collections in their own business, whether rate changes are improving cash flow, and whether fixed family obligations are still rising faster than income.
Important notice
This article is for general information and education only. GDP is an aggregate statistic and does not represent the actual income growth of any individual household, company or industry.
G70 family lens
Do not substitute one GDP figure for cash-flow analysis
Household and corporate income, costs, employment and balance sheets respond through different channels and at different speeds.
- Are household income and business cash flow improving together?
- Which expenses and liabilities are most sensitive to rates and currencies?
- Can the sources of growth persist into the next quarter?
Official and primary sources
- Hong Kong Government | Second Quarter Economic Report 2026 (2026-08-14)
- Hong Kong Government | Advance estimates on Gross Domestic Product for second quarter of 2026 (2026-07-31)
Sources were checked on the publication date shown above. Regulations, policies and market data may subsequently change.